


Hire an Expert for Python Data Analysis.
Python is a popular general-purpose, advanced programming language. It was the most popular programming language in 2024, with a 28.11% market share, and this can be attributed to the presence of more than 137,000 "libraries," which make data analysis more efficient. If you are searching for expert Python data analysis services, our professionals analyze and interpret data using Python’s powerful libraries to gain meaningful insights. In addition, this post is a comprehensive guide on why you should use Python for data analysis, how to use it, and practical examples.
Why Use Python For Data Analysis?
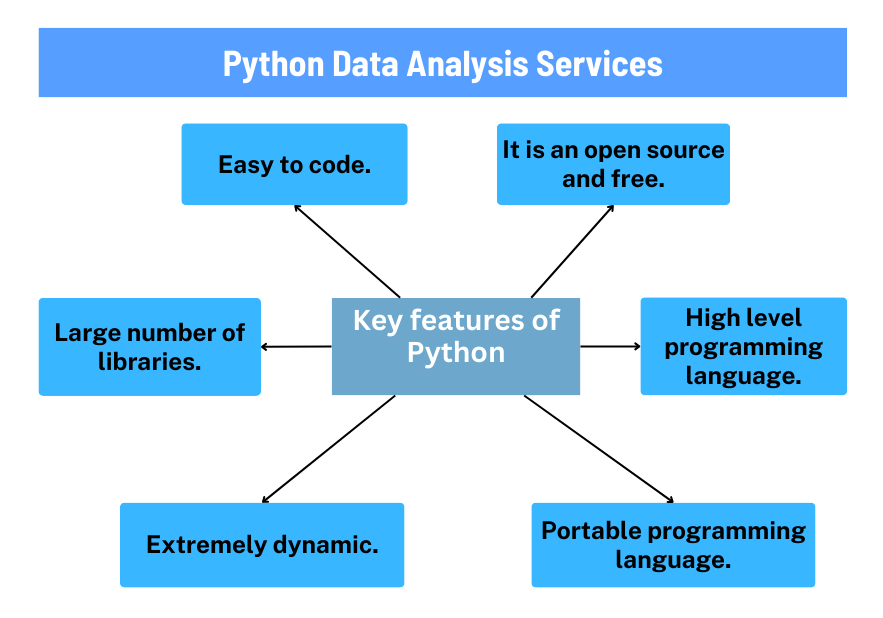
Most researchers and data analysts wonder 'Is Python good for data analysis?' Yes, Python has features that put it at a greater advantage compared to other programming languages. Below are reasons why you should use Python for data analysis:
(1). Easy to learn
Python's central point of consideration is being simple and straightforward to users thus making it the best for beginner developers. It enables software program engineers to use fewer pointers of code to complete tasks, hence reducing the complexity of coding.
(2). Freely available
Python is open-source, which means that its source code is readily available for use or improvement by other developers. It can also be used on multiple operating systems, such as Windows and Linux and can be ported on multiple systems. Python also has multiple open-source libraries, such as Pandas and Numpy which allow them to perform functions such as data visualization, re-indexing, and conversion of data.
(3). Well-supported
Python has an active and supportive community of the best developers and data analysts globally so there is availability of free resources accessible online. Additionally, Python users seeking help with the language can use the website Stack Overflow, a popular website for programmers.
How to Conduct Data Analysis Using Python
Step 1: Install Python
There are three key operating systems that Python can be installed from and they are Windows, Linux, and Apple. For Windows, begin by downloading the Anaconda Installer, then open the Command Prompt application (cmd.exe), click on the Start menu, and click Command Prompt. Launch the Python interpreter by typing the word Python. Alternatively, you can install the programming language from python.org.
Step 2: Data collection and storage
Data can be collected by either loading it from data storage systems or collecting survey data. The first step is transferring the collected data from the file into Python for cleaning and preparation. You can either extract your data from comma-separated values (CSV) files or send data between web browsers and software applications using Javascript Object Notation (JSON). A CSV file separates each data set with a comma. The first row acts like the heading explaining the file contents then the other rows contain the real data. JSON is more of a free-form data format than CSV, which is in tabular form.
Data is then stored using either Python's built-in pickle serialization or using Hierarchical Data Format (HDF5) format. The former is usually recommended for short-term storage format while the latter is for large quantities of scientific data.
Step 3: Data cleaning
Cleaning and preparing your data means checking for poorly formatted, duplicate, incomplete, and incorrect data. Pandas and other Python features have flexible, reliable tools that enable the user to manipulate data in the right form. To clean your data, begin by handling missing values. In Python, missing values are shown by a floating point value NaN (Not a Number). You can either filter out the missing data using boolean indexing or fill in the data using the fillna method. Consequently, duplicate rows can be found in a data set; these can be removed by using the drop_duplicates () function. You can then store your data using the .to_csv() method.
Step 4: Data wrangling
Data may be spread across a number of databases or arranged in a way that is not easy to analyze, combining such data is referred to as data wrangling. Hierarchical indexing in pandas is one of the most common methods for this operation. It enables you to have multiple index levels on an axis, enabling you to work with high-dimensional data in a low-dimensional form.
Step 5: Data visualization
Python has data visualization libraries such as Matplotlib and Seaborn. Matplotlib is a desktop plotting package used for creating mostly two-dimensional quality plots such as line graphs and bar graphs while Seaborn is mainly used for complex statistics visualization.
Step 6: Data analysis using Python
You can now analyze the cleansed data to derive insights. Begin by creating a visualization of the variables under research. The shape of the figure gives you an idea of whether there is a relationship between the variables and whether it's quadratic or linear. Give the plot a title and label the axes to make it easier for the reader to understand.
Hire the Best Python Data Analysis Services
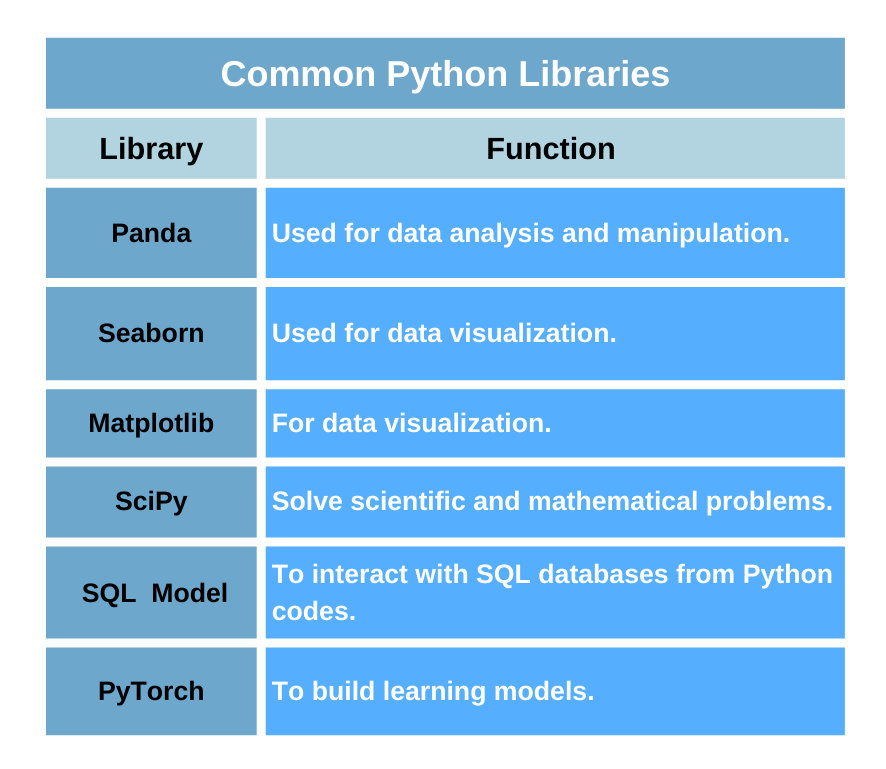
Our data analysis experts utilize Python libraries such as Panda, Numpy, and Scipy to perform comprehensive data analysis to produce meaningful results. They then visualize the findings for easy understanding and implementation. Our services also offer customized solutions, including training and consultations for developers seeking to improve their data analytics with Python.
Get a Top Python Data Analysis Expert From Our Company
Every expert in our Python data analysis services has a degree in Computer Science and an additional certification in Data Science with Python. They are familiar with and have extensive experience working with all the libraries and deliver quality reliable results.
Our professionals have extensive industry-wide knowledge having worked with data analysis projects in fields such as healthcare, marketing, engineering, and science, among others. Regardless of your field of research, we have an expert who can handle your data analysis request.
Our data analysts offer customized solutions specific to your data analysis needs. They can perform data entry and cleaning, visualization, consultation, and training services. They can also use Python for multiple forms of analysis, such as geospatial and time series data analysis.
Our experts take advantage of Pythons' advanced tools and techniques to swiftly work on your data analysis projects to ensure that the results are delivered on time without compromising on quality. The high familiarization with the programming language by our expert developers puts them at a greater advantage in delivering quality findings.
Summary
Python is a highly recommended multi-purpose programming language used by several organizations and professional developers worldwide. Its popularity is due to its user-friendly features such as the presence of libraries like Panda and Numpy, which make data analysis simpler.
Other aspects that make it popular include its free availability, how it is well-supported by other developers, and how easy it is to get familiar with even for beginners. One can also hire a Python data analysis expert from our services for help with the programming language. Our professional data analysts offer customized solutions and work within your desired timeframe.
Our data analysis experts have experience working with Python for data analysis in numerous fields such as health care (e.g., to produce clinical trial analysis reports), science, public health, and so much more. So, are you looking for an expert to help with Python for data analytics? Reach out to our experts today! We offer the best statistical consulting services online with a quick turnaround time. Our professionals also offer data analysis services using other programs such as SPSS, STATA, SAS, R, Power BI, and Minitab. Contact us and request a free quote now to get started!