


Data Analysis Services with SPSSYe Conducted by Expert Statisticians
What is SPSS in Data Analysis?
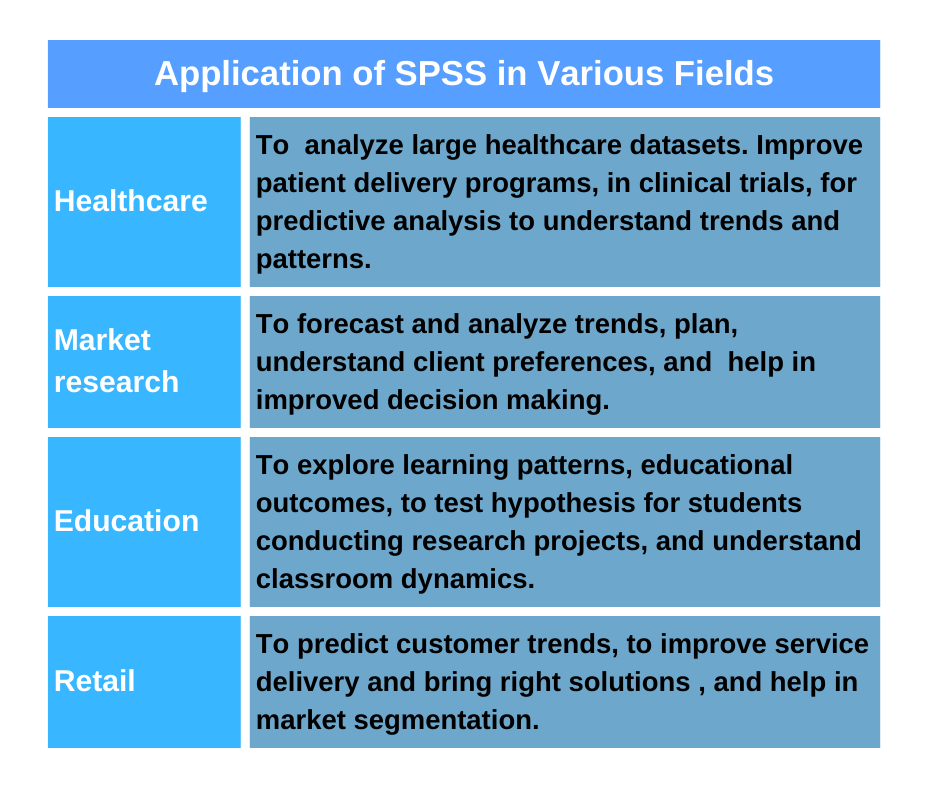
The Statistical Package for the Social Sciences (SPSS) is a software not only used by social scientists, but also by market, education, and health researchers, among other professionals to process and analyze data.
Researchers and scholars who outsource data analysis with SPSS for their thesis papers, capstone projects, dissertations, or research papers have a lot to gain from the services including expertise of the statisticians, saving time, and having the results presented in a professional manner and explained in layman's language.
Research shows that the SPSS was the most popular software package widely used in 2018 to analyze data for over 80,000 published articles; being 66% higher than the preceding program.
Our company offers professional SPSS data analysis services across fields and subjects to assist scholars and researchers in drawing valid conclusions for their projects and other papers. We offer data analysis services for students pursuing masters (e.g., MSN and MBA), and Doctoral studies (e.g., DNPs and PhD), businesses, and institutions to gain meaningful insights into their data. This article contains a detailed discussion on the factors we consider to offer the best SPSS data analysis help to our clients.
Considerations When Conducting Data Analysis with SPSS
Our SPSS data analysis services are designed to assist researchers, students in their college or university education, and other professionals to plan, collect, and analyze raw data and prepare reports for different target audiences. The software is commonly used in education, healthcare, and market research to find solutions for specific problems and provide insights that can inspire decision-making. Some of the factors we consider when analyzing data using SPSS include:
1. The Type of Data Collected
In order to effectively conduct statistical analysis, our experts must first understand the type of data in question, whether it is primary or secondary data or qualitative or quantitative data. The basic data types in quantitative analysis can be classified into either numerical or categorical. Numerical data are expressed in numbers and can be discrete or continuous. Categorical research data can be expressed by categories, groups, or factors and can be nominal or ordinal.
We provide expert SPSS data analysis for different types of research papers or capstone projects regardless of the academic level or subject. A scholar or researcher who opts to hire a statistician to conduct data analysis with SPSS can contact us for the best service and findings report on their research paper or project.
2. Is the data is paired or not?
After categorizing the research data as either numerical or categorical, we further seek to understand whether it is paired or not. Paired categories of data are related to each other and are mostly as a result of before or after interventions, treatments, or situations. Unpaired categories of data are not related to each other. Understanding the type of data is fundamental when choosing the most suited statistical method to use in our analysis services.
3. Is the data Parametric or non-parametric?
When dealing with numerical data, our SPSS data analysis experts must clarify whether such data are parametric or non-parametric. Parametric data are normally distributed, symmetric, and if plotted can fit on a bell-shaped curve. Non-parametric data are not normally distributed. Understanding the distribution is important to professional data analysts when choosing the most appropriate statistical tests that can be run to obtain accurate and reliable results.
4. The purpose of the statistical analysis / data analysis with SPSS
Statistics assignments given by tutors and academic supervisors require extensive utilization of the SPSS programs. We have experienced SPSS experts who can successfully conduct analysis and write quality reports for the study questions without altering research objectives. However, one must understand the purpose of conducting the SPSS data analysis.
Depending on the number of data sets available, one may be looking for differences or correlations when conducting quantitative analysis using the SPSS. In addition to the purposeful SPSS data analysis services, our experts are also capable of writing findings reports for advanced research papers. The data analysis section in our written research papers appropriately answers the study questions and demonstrates the achievement of the objectives.
5. Structure and format of the data for SPSS analysis
Before data entry into the statistical software package, it has to be structured into an acceptable format. We organize the data in SPSS depending on its type and the analysis one intends to carry out. Each study subject is input in its specific row.
6. Type of statistical analysis required
Most data analysis companies use both inferential and descriptive statistics. Our specialists who offer SPSS data analysis services are well-versed with the two types of statistical analyses as discussed below:
a). Descriptive statistics
We can effectively calculate descriptive statistics and split out numerical data in tables. Where necessary, we calculate measures of central tendency such as mean, mode, and median. There are circumstances when it is necessary to calculate the measures of spread which include the interquartile range and standard deviation.
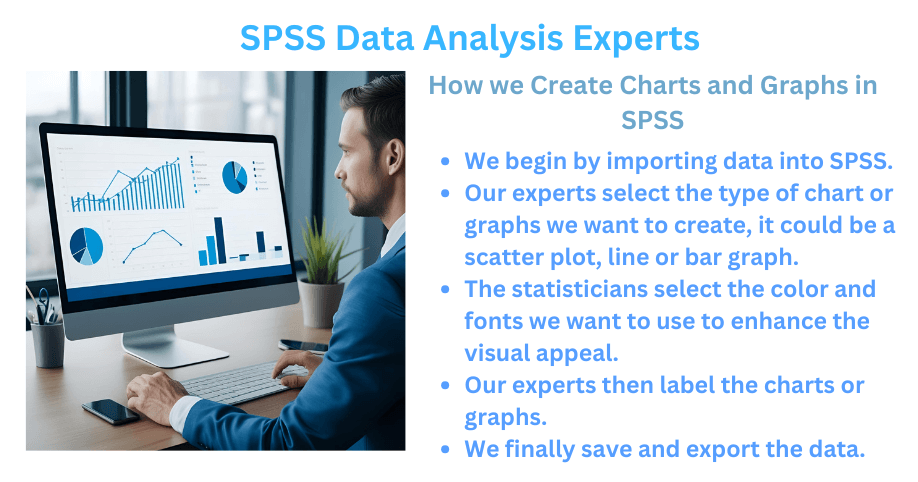
In addition to calculating the descriptive statistics, our reliable SPSS data analysis services also entail exploring the data, understanding, and visually representing it using different types of graphs. The graphs are imperative in visualizing data when exploring it and presenting results of relevant statistical analyses.
b). Inferential statistics
Inferential statistics are useful when drawing conclusions after a successful SPSS analysis. Hiring SPSS experts from a credible company like ours gives one an assurance that the right statistical test will be run on their data for reliable results.
Although the statistical analysis only produces a mathematical representation, we are capable of interpreting such representations and drawing inferences that can be written down as qualitative descriptions of the real world. Both null and alternative hypotheses must be constructed depending on the research questions before running the statistical test. We also assess the normality of the data as it can greatly affect findings.
7. Appropriate statistical tests
Choosing the most appropriate statistical test to be run on data depends on factors such as:
- Type and number of variables involved in the study.
- Type of questions to be answered.
- If the collected data is categorical or numeral.
- The number of categories present.
- Whether the data is paired/unpaired, parametric, or non-parametric.
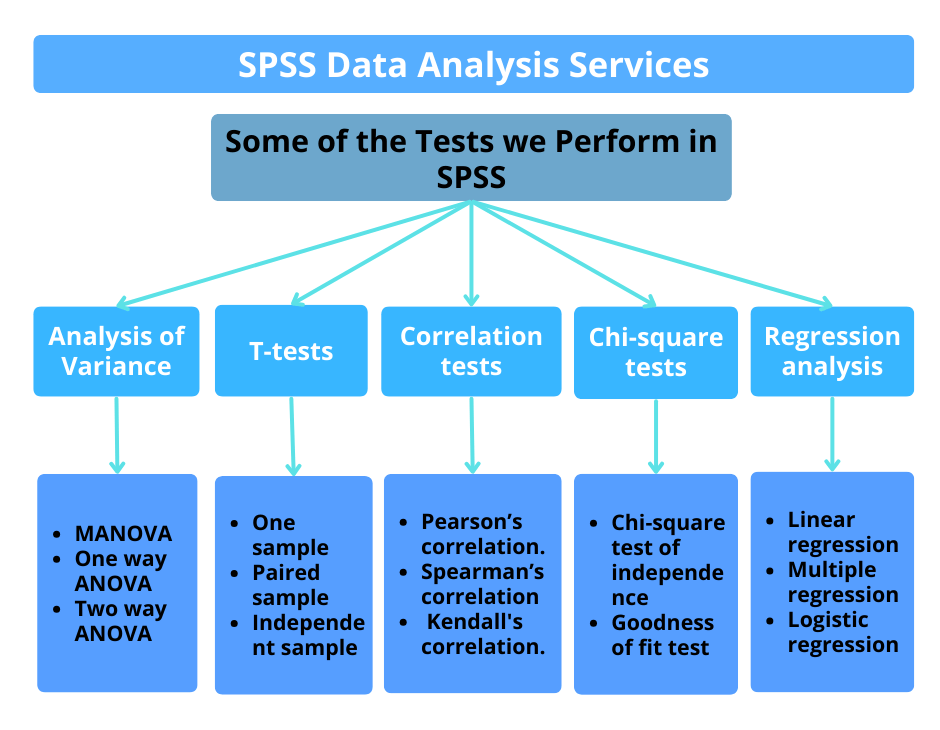
After considering these factors when offering SPSS data analysis with SPSS, our experts choose the type of test to run on the data to produce correct, valid, and reliable results and answer the research questions. The statistical tests include the t-test, regression analysis, analysis of variance(ANOVA), multivariate analysis of variance (MANOVA), correlation, the chi-square, and others as deemed appropriate for the data.
After making the decision to purchase the services of an SPSS data analyst from our company, one can rest assured of the best results; from the data entry stage, through the analysis process, to the drawing of inferences.
8. Understanding the SPSS output
The SPSS statistics may produce multiple tables and output after running the chosen test. It is, therefore, imperative to understand which of the tables or output is relevant for one's research question. For every table, number, or figure obtained from the analysis, our experts explain the meanings and help readers understand and distinguish between the results that are statistically significant from those that are not.
We provide a guide to our clients and general audiences to gain a thorough understanding of the output of the SPSS statistics using direct and jargon-free language. Through the guide, one can interpret the results on their own without necessarily being an expert in a particular subject or field.
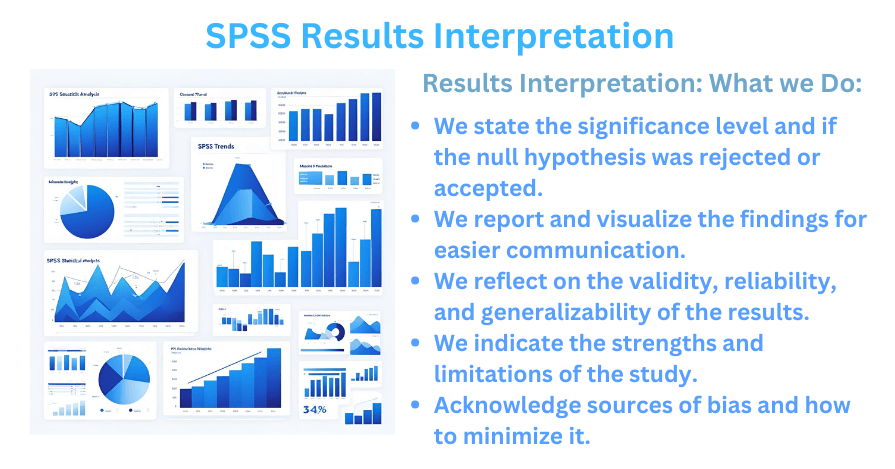
9. Interpretation of results Obtained from the Data analysis with SPSS
To interpret the results of the analysis correctly, we must find the test statistic, determine its level of significance, and state whether the null hypothesis was rejected or approved. Moreover, the SPSS data analysis helpers write down the results which must include the answer to the study question, the test statistic, degree of freedom, and the type of test run on the data; and plot an appropriate presentation for relevant analyses such as ANOVA, regression, or correlation.
The level of complexity determines the appropriate plot for the results.
10. Reliability and sensitivity
The reliability in SPSS data analysis can be determined by evaluating the consistency of measurements. Sensitivity can be established by assessing to what extent the measurements can detect the true effects of a treatment or intervention.
11. Presentation of the written statistical copy
As we write research papers and statistical reports, we comply with the guidelines and standards of the form and content in the particular field while observing the requirements of clear communication in scholarly work. The report writing for the findings of the statistical program involves selecting a presentation medium that effectively optimizes the understanding of the audience for the data. Our SPSS data analysis experts can present the findings in figures, tables, or text, depending on the nature of the analysis conducted.
In our report writing services on inferential statistics such as the t-test, chi-square, associated confidence intervals, and effect sizes, the experts provide adequate detailed information for readers to completely understand the type of analysis conducted and the essence of the SPSS project.
What constitutes sufficient information on inferential statistics is dependent on the analytical approach. When reporting the findings, we ensure that statistics represented in tables or figures are not repeated in the text. All the elements and labeling of figures or tables used in our SPSS reports are correctly placed and captioned accordingly. We are conversant with the various symbols and abbreviations to present statistics and can, therefore, use them appropriately.
12. The organization of the report containing the data analysis results
The overall organization of the findings from statistical methods of analysis determines its visual appeal, readability, and comprehensibility among readers. We, therefore, organize the sections in an appealing manner or according to the clients' preferences. Some of the common elements that are included in the report can be arranged as follows.
a). The overview of the research problem
With clarity and concision, we provide an overview of the research objectives, problem, and the type of question(s) that the SPSS analysis sought to answer.
b). Type of data and model of analysis used
We describe the type of data that was available for analysis and the statistical approach used. With specificity, our expert analysts describe the type of tests that were run on the data and the procedures involved in the SPSS analysis. Where applicable, plots are included to help readers understand the type of data or the problem under study.
c). The results/output
The results section of the report comprises well captioned and labeled tables and figures which can be referred to using numbers during discussion. Some of the components of the results section in SPSS analysis may include pictures of the data and tables that demonstrate the fitted models, summaries, and coefficients.
d). Conclusion
In the concussion section, we present the implications and significance of the analysis; whether the research questions were answered or not, and hypotheses or statistical assumptions approved or rejected.
Only the best analysts are allowed to work on our clients' papers and assignments. One should rest assured of the best analysis services using the SPSS or any other statistical program. Those who would like to hire a statistician to analyze data using SPSS can count on us. We have properly trained personnel to deliver the best SPSS help in time for a thesis paper, dissertation, capstone project, and other relevant assignments.
Benefits of Hiring Our SPSS Data Analysis Experts
Providing high-quality SPSS data analysis help has been our priority over the years because we genuinely care about clients' excellent performance in their papers and assignments. As professional SPSS data analysis service providers, we can help advanced-level students correctly work on their gathered data with the aid of the widely used program.
We offer the best SPSS data analysis services to help clients complete their papers and significant projects within the given timeframe amidst professional, academic, or family commitments.
Some of the benefits of hiring a statistician to analyze data using SPSS from our company include:
- The 24/7 availability of our SPSS data analysis services enables us to meet clients' demands and needs at all times. Our expert writers and analysts provide high-quality services on demand without hesitation.
- We ensure timely delivery of analysis services and SPSS findings report writing, thus, clients are assured of receiving their papers within the agreed period to avoid the embarrassment of submitting to the target audiences past deadlines, which can ruin the first impression and result in poor grading.
- Although we provide high-quality SPSS data analysis services at reasonable prices, our company has a money-back guarantee policy in case the client is not contented with the assistance received.
- We maintain the utmost originality of every assignment entrusted to us by clients. Our written work is plagiarism-free because we use the SPSS to analyze the collected data and write the original reports on the findings. Those who purchase the services of an SPSS data analyst from us are assured of authentic work because, in addition to the best plagiarism checkers, we have professional human editors who review the work to ensure it is perfect and precise.
- The company comprises experienced SPSS experts who are diligent and committed to helping clients in excellent statistical analysis of quantitative data.
- Free unlimited revisions are acceptable until the client is satisfied with the analysis and findings report writing services.
- Availability of editors and proofreaders in our team ensures strict quality checks for the work, ensuring the best professional SPSS data analysis services offered to the clients produce high-quality results and written reports.
- Our work is free from all grammar and usage errors, inconsistencies, plagiarism, and any issues related to the mechanics of style.
- We strictly adhere to the given style guides, instructions, and requirements.
The SPSS data analysis process that we provide can begin from the collection stage, depending on the clients' needs. We help clients collect data using questionnaires in quantitative research design or interviews for a study preferring qualitative descriptions.
Our professional SPSS data analysis services assist researchers and scholars who may not have the time to comprehend the packages and use them because of other commitments.
Those wishing to get help for data analysis with SPSS or any other statistical program of their choice can count on us. All orders and assignments are processed and submitted within the agreed period of time, hence, our clients do not experience the embarrassment of submitting past deadlines specified by the receiving audiences. Join our live chat now and talk to our competent customer service agents and let them know how we may help you.