


Help With Analysis of Variance (ANOVA) Test
What is ANOVA?
Analysis of variance (ANOVA) is a parametric test in statistics used to measure the significant differences between the means of two or more groups in reference to their variances. ANOVA does not detect precisely which groups the difference lies in. When comparing differences between multiple sample/populations, we use multivariate analysis of variance (MANOVA).
There are two estimate types in ANOVA: variability between groups (effect variance) and variability within groups (error variance). The estimates are compared using the F-statistic.

ANOVA works under the assumption that the sample sizes are equal, equal variance, the samples have a normal distribution, and the samples are independent. ANOVA is divided into three types, but the two main types are one-way and two-way analysis of variance, and the other is repeated measure analysis of variance.
The ANOVA table disintegrates components of variation in the samples into variation between treatments. ANOVA test can be done using software such as Minitab, Excel and SPSS.
Assumptions Made in ANOVA
Assumptions made in ANOVA include samples are from a normally distributed population, equal sample sizes in the groups, the observations used are independent, and equal variance across the groups.
Data provided are tested for a normal distribution using plots such as histogram and QQ plots and goodness of fit tests such as Kolmogorov Smirnov test and the Shapiro-Wilk test. The goodness of fit test uses the null hypothesis principle to check for normality in the data.
The observation should be independent. Numerous measurements from the same group should not be treated as a separate observation. The requirement for the samples to be independent is not always met because the samples are randomly chosen. The samples from the different groups should be equal in number, and their variances should be equal.
Types of ANOVA
(a). One-Way ANOVA
The one-way ANOVA compares the mean of two or more groups for one dependent variable. One-way ANOVA is used when there are more than two groups. A minimum sample size of thirty is required to carry out one-way ANOVA.
A sample of more than thirty increases the chances of type 11 error. The null hypothesis for one-way ANOVA states that the means of the two independent groups are equal: Ho: μ1= μ2…= μk, where μ is the mean of the group and k is the number of groups.
In the presence of a statistically significant difference between two or more groups’ means, we reject the null hypothesis. To reduce the chances of type 1 error occurring, the level of significance (α) is lowered.
(b). Two-Way ANOVA
A two-way analysis of variables is used when one variable is quantitative and two are nominal variables. The samples are defined in two different ways, and the output is categorized. Two-way ANOVA examines the effect of two nominal variables on a dependent variable.
(c). Repeated Measure ANOVA
Repeated measure ANOVA analyzes the equality of means of three or more groups. Repeated Measure ANOVA is applied when all the variables of a sample are measured under diverse situations and time. Measurement of the dependent variables is repeated. The assumption regarding the independent variables is not considered in repeated measure ANOVA.
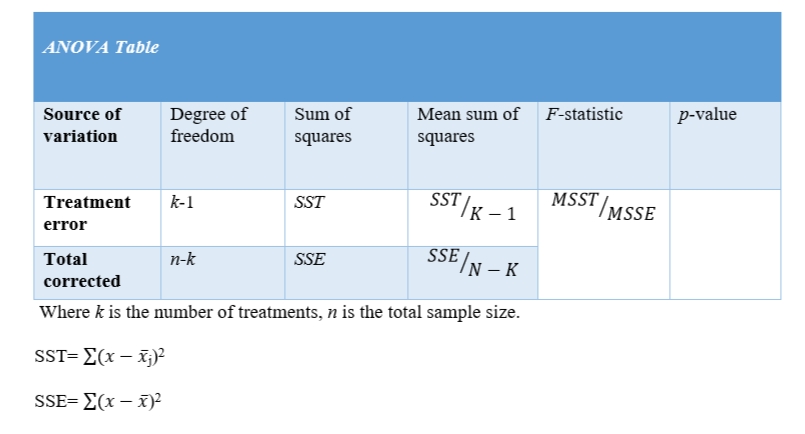
ANOVA Table
Summary
Analysis of variance (ANOVA) is used in statistics to test the significance of a study. ANOVA works on quantitative data type hence a parametric test. It compares the mean of two or more independent groups in reference to their variation. The one-way ANOVA is mainly used when there are more than two groups.
The null hypothesis is rejected when there is a significant difference between groups’ mean. Assumptions such as equal sample sizes, equal variance, normal distribution, and independent observations are made during the ANOVA test.
In repeated measure ANOVA, the independent observation assumption is disregarded because the samples are measured differently and repeated. Samples in the group should undertake a normality test to check the viability of the data so as to produce conclusive results.
The ANOVA table disintegrates the data into variations between treatments for a conclusive comparison between the F-statistic and the P-value obtained in the study.
In case you need ANOVA services, look no further, as we have professional statisticians with years of experience conducting data analysis for our clients successfully. We also offer other analyses, such as multivariate statistical analysis, t-tests, and regression analysis, among others. Write to us on our live chat or follow our order process page to make any inquiries and learn more about our services.