


Hire an Expert for Excel Data Analysis
Data analysis is the application of tools and techniques to a set of raw data to discover useful information that can be used for decision-making.
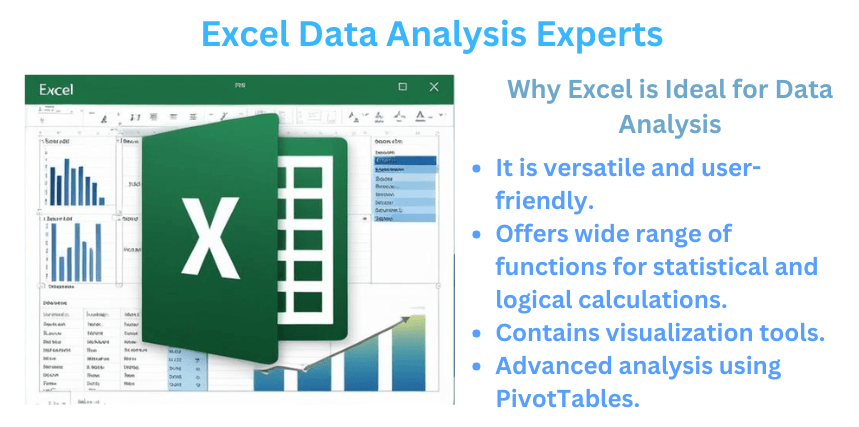
Microsoft Excel is a software that offers a wide range of tools that can solve both easy and complicated data analysis processes. In case you are in need of expert Excel data analysis services, our professionals offer personalized solutions to derive insights from raw data sets. Excel is one of the most popular spreadsheet applications, with users averaging 1.1 to 1.5 billion as of 2023.
This post is a comprehensive guide on how to add and conduct data analysis in Excel, data visualization, and the most useful Excel functions for analysis.
Useful Tools and Functions for Excel Data Analysis
Excel normally has tools and functions that make the data analysis process easier and more efficient. Below are some of the tools found in Excel:
(1). What-if analysis tools
What-if analysis is a technique in which the analyst sets up worksheet models to analyze hypothetical situations. It allows the user to have Excel change the values in cells so that they can identify how the conversions affect formula outcomes. Microsoft Excel software offers four tools for this analysis, including data tables, Goal seek, solver, and scenarios.
(2). Conditional formatting
In conditional formatting, Excel applies only to cells that fit the specific criteria that you have specified. When setting up the conditional format, you can specify the font, background pattern, and border, and this ensures that the cells that fit the criteria stand out from the others in the data set. It can also be used to identify duplicate and top or bottom values within a range.
(3). Sort and Filter
Sort and filter is an Excel feature that gives the user access to a set of commands that perform various actions on a column, for example, sorting or filtering the data. Sort data to quickly organize and locate data. Filter data to display only the rows that meet the criteria that you specify and hide rows that you do not want to be displayed for one or more columns of data.
(4). PivotTable
PivotTable is a powerful and versatile data analysis tool that enables the user to summarize thousands of records in a concise tabular format. The data in multiple fields in the data set can become row and column labels in the pivot table. It also allows you to manipulate its layout to get multiple views of your data.
(5). Analysis ToolPak
Analysis toolPak is an add-in that consists of 19 statistical tools that can calculate descriptive statistics, i.e., the mean and standard deviation, and more complex results, such as the moving average and the rank. The tools can also be used to do inferential statistics, such as regression and correlation.
(6). Solver
Solver is a function that uses a repetitive method to perform its calculations. It does a repetitive procedure of trying a solution, analyzing the results, and examining the change of results with each calculation, then using complex mathematical processes to predict the findings of the solution.
Most Useful Functions for Data Analysis
(1). COUNT & COUNTA
The Excel COUNT function enables the counting of cells available in a given range containing numeric values. While the COUNT function only deals with cells containing numbers, COUNTA gives a count of cells that are not blank. These cells can be dates, time, text, errors, or logical values of TRUE or FALSE.
(2). TRIM
The TRIM function is used to remove unwanted spaces in Excel. If correct Excel formulas return a bunch of errors, one of the first things to do is evaluate for extra spaces in the referenced cells. To apply this function, enter the formula in the cell then copy it down the column.
(3). AND & OR
AND & OR are the most popular functions used to check criteria. AND returns the response of TRUE if all conditions are met and FALSE if not. OR replies with TRUE if any condition is met and FALSE if not. These functions are rarely used on their own but are applied as part of bigger formulas.
How to Conduct Data Analysis in Excel
Step 1: Download data analysis on Excel
Begin by clicking the File tab then click Options and finally click on Add-Ins. You will be directed to the Manage box, select Excel Add-ins then click Go. In the Add-ins tab, click the Analysis Toolpak then click Ok. Once enabled, the data analysis tab appears in Excel.
Step 2: Data cleaning
Before beginning with the data analysis, the data should be cleaned to get rid of errors that may interfere with the results such as duplicates, missing values, and ensuring standard formatting.
Step 3: Conditional formatting
Conditional formatting is highlighting cells with different colors depending on their importance. Conditional formatting in Excel allows users to label or color values in cells according to predetermined criteria. Other factors that can be done by this formatting method are comparing two lists, identifying duplicates, or making heat maps.
Step 4: Sorting and Filtering, then Using Lookup functions
Two main functions in Excel are used to arrange data based on columns and rows. Additionally, lookup functions enable the user to identify data values that fit specific criteria in a large data set. The main functions used in this step are the Vlookup and Hlookup. These functions are used to derive important data from multiple Excel sheets.
Step 5: Insert Pivot tables
A pivot table allows you to summarize the main points of data and create reports by modifying its contents. Inserting pivot tables is the most practical step in the data analysis process. After inserting the table, you can drag, sort, or filter the findings.
Step 6: Data visualization
Visualization in data analysis is done using features such as line charts, bar charts, column charts, area charts, or scatter plots. These features make the results easier to understand and interpret.
Why Choose an Excel Data Analysis Expert From Our Services?
- Our services have the best data analysts who have extensive experience conducting data analysis and have advanced degrees in fields such as Computer Science, Data Science, and Statistics. They conduct rigorous analysis, delivering quality and accurate results crucial for decision-making.
- Our experts are proficient with simple and complex Excel data analysis procedures and tools. No matter the complexity of your project, our experts can handle it, ensuring that your analysis is done with precision.
- Even after the analysis is complete, our experts offer post-sales services, such as guiding you through decision-making based on the analysis findings or how to interpret the results.
- Our experts work within your desired timeframe to deliver analysis results. When requesting a free quote, you should specify the time you wish your project to be completed, and our experts will work on it promptly.
Summary
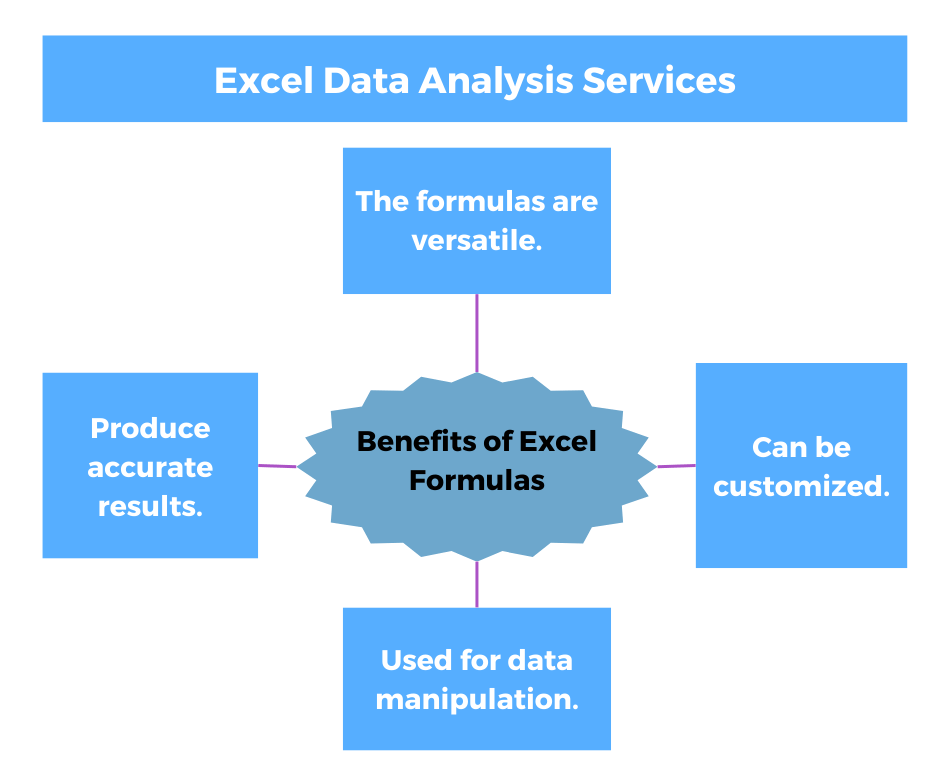
Data analysis is the practice of applying tools and techniques to a set of raw data to gain meaningful insights from it. It can be done using various software such as Excel and SPSS, which offers a variety of features that ease the analysis process. Excel can be utilized to conduct inferential statistics such as regression and descriptive analysis such as standard deviation.
Due to the presence of advanced functions for data analysis and tools, Excel has become the most popular analysis software globally. Additionally, it has visualization features such as charts and PivotTables that present the findings of the analysis for easy understanding to the reader.
You can gain meaningful insights from your raw data set by hiring our Excel data analysis expert. Our professionals offer customized solutions specific to your analysis needs. Hire the best data analysts from our company today for accurate findings useful for decision-making. Review our order process to place an order. We are available 24/7 to respond to all your needs promptly. Contact us to make any inquiries regarding data analysis and we will respond swiftly.